What the rocket measures, what software reads it, and how a crew of Scouts turns a radio signal into a flight they can fly again on a screen. The short answer on software: Serial Studio for the live dashboard, a Python script the Scouts write for the log, and the 3D replay on this page for the debrief.
Speed + altitude + position
Free software
No soldering
3 tools, 3 jobs
See a flight
This is a simulated Lil’ Spite flight on an E16-6 with the telemetry payload aboard — 497 ft,
37 seconds, 5 mph of wind. After November 21 you paste in your own CSV and this becomes your flight.
3D flight replay
Drag to orbit · scroll to zoom · scrub the timeline. Loaded with a demo flight — paste your own CSV below after launch day.
T+0.0 s
Ready
Load your own flight
Paste CSV with one row per sample. Columns, in order:
time_s, altitude_m, speed_ms, latitude, longitude.
A header row is fine — it gets skipped. This is exactly the file the ground station writes.
What software to use
Run all three. They do different jobs and the redundancy is the point: launch day should never depend on code a Scout finished that morning.
What it is. Built into the Arduino IDE you are already using to flash the boards. Print comma-separated numbers and the Plotter draws them live. This is how you confirm on crew session 1 that a packet is actually crossing the room.
Why. Zero setup, so there is no excuse not to check the link early. It is not a launch-day tool — it cannot log or lay out a dashboard — but it is the fastest way to answer 'is anything coming through at all?'
What it is. Open-source cross-platform telemetry dashboard. Reads the serial port from the Heltec over USB and gives you gauges, live plots, a map, and CSV logging — plus replay of a saved CSV. You design the dashboard by dragging, or by writing a small JSON project file, not by writing a program.
Why. This is the pick. It turns the ground station from a scrolling wall of numbers into something a crowd can watch, and it logs the CSV you need afterwards whether or not the Scouts' own logger behaves. Windows, macOS, Linux, and it runs on a Raspberry Pi if you want a dedicated box.
What it is. A script that opens the serial port, reads each line, timestamps it, and appends it to a CSV. Then a second script that reads the CSV back and plots altitude against time.
Why. This is the badge work. It is a real program with input, a decision, and an output — which is exactly what Programming requirement 5 asks for — and writing it with an AI assistant under supervision is the Artificial Intelligence badge project. Serial Studio is the safety net so this can fail without ruining launch day.
3
The 3D replay on this page
The debrief
Cost
Free
Code needed
None — paste the CSV
Counts toward
Engineering 4 · Aviation 1e
What it is. Paste the flight CSV into the box below and the whole flight replays in 3D: trajectory, ground track, apogee, and the walk-out distance.
Why. On November 23 you want the troop looking at their own flight, not at a spreadsheet. It also makes the predicted-vs-measured conversation concrete — the shape of the curve shows where the drag was.
Also considered, and why not
Meshtastic app on a phone
Tempting — the T-Beam runs Meshtastic out of the box and you would get GPS positions on a phone with zero code. But it gives you position only, no barometric altitude, at roughly one update per second. Fine as an emergency rocket-finder; useless as flight data, and it skips all the coding the badges want.
Telemetry Viewer
Open-source Java dashboard in the same family as Serial Studio. Works well. Serial Studio wins on installation friction and on having replay built in.
Grafana + InfluxDB
What you would use for a fleet of sensors running for months. For a 37-second flight it is a database administration exercise wearing a telemetry costume. Skip it.
OpenRocket
Not a tracking tool — it is a flight simulator. Genuinely useful, but for BEFORE the flight: it predicts apogee and stability so Scouts can sanity-check the prediction they sealed.
What we measure, and with what
Three numbers matter, and they come from two different sensors for a good reason. Get this wrong and the data looks fine but means nothing.
Altitude
Barometer (BMP280 / BME280)
Air pressure drops predictably with height. A barometer resolves about ±1 ft and updates 20+ times a second, which is what you need on a flight lasting six seconds to apogee.
Watch out. Do NOT use GPS altitude for this. GPS is vertically noisy by ±15–30 ft — on a 500 ft flight that is a 6% error before you have done anything wrong, and it updates once a second. Check which sensor variant of the T-Beam you received; if it has no barometer, a BMP280 breakout is about $6 and solders to three wires.
Speed
Derived from altitude, checked against the IMU
Vertical speed is just the change in altitude divided by the change in time. Compute it on the ground from the logged data rather than on the rocket — it keeps the flight code simple and lets you re-derive it later with better smoothing.
Watch out. Raw differences are jumpy. Average across three samples before you plot it, or the graph looks like a seismograph and Scouts will think something is broken.
Position
GPS (L76K on the T-Beam)
This is what gets the rocket back. Horizontally GPS is good to a few metres, which is plenty to walk to. It is also what draws the ground track in the 3D replay.
Watch out. GPS needs a cold-start lock of several minutes with clear sky. Power the payload up early, confirm lock BEFORE the rocket goes on the rail, and keep the 18650 in — pulling the cell loses hot-start.
The packet format
The crew has to agree this before anyone writes code, because it is the boundary between the two teams. Flight Software owns what goes in; Ground Station owns what comes out. Write it on the whiteboard and do not change it without telling the other half of the room.
Literal marker so the receiver can spot the start of a frame.
1247
Milliseconds since power-on. Your time axis.
151.6
Barometric altitude above the pad, in metres.
18.4
Vertical speed in m/s. Positive is up.
35.305000
Latitude, six decimal places (about 10 cm of resolution).
-120.710000
Longitude.
9
Satellites locked. Below 6, treat the position as a rumour.
COAST
Flight state: BOOST, COAST, DESCENT, LANDED.
The /* */ wrapper is Serial Studio's default frame format, so this parses with no custom code at all. Keep it and you save yourself an evening.
Rate. Send 10 frames per second during boost and coast, then drop to 2 per second under parachute. LoRa is slow — roughly 1 kB/s at the settings that reach a kilometre — and flooding it is how packets start disappearing at exactly the moment you care about.
Launch-day procedure
The Telemetry Officer owns this list. It is short on purpose.
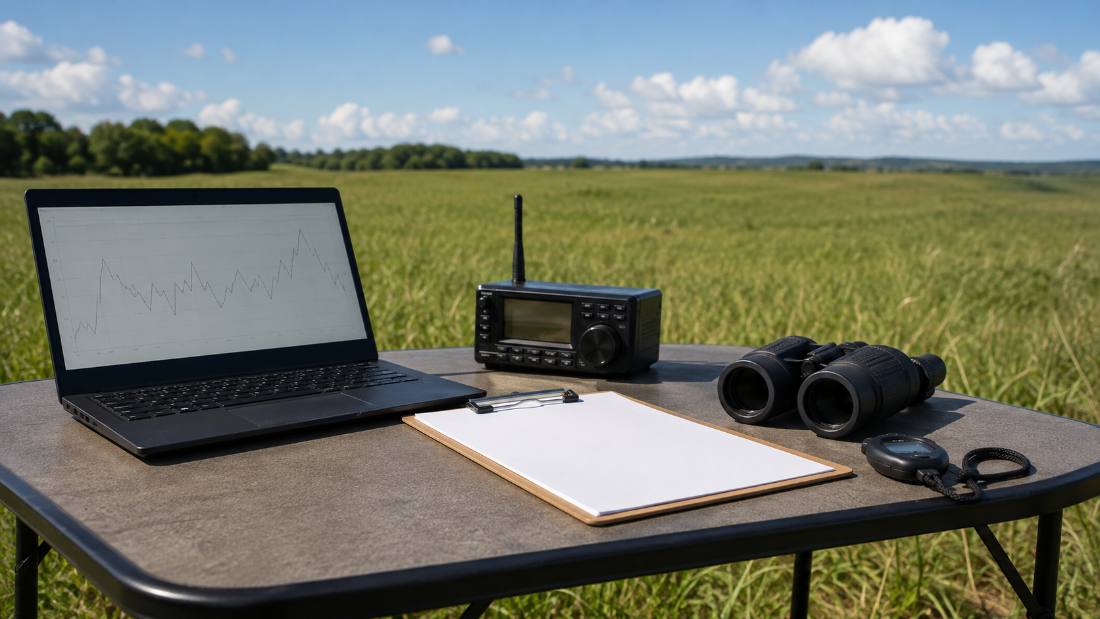
Mission control, Troop 308 edition. Laptop, ground radio, flight cards, binoculars, stopwatch — that is the whole range.AI-generated illustration
T−30 minPower the payload on the table, not in the rocket. Confirm GPS lock (needs sky view and a few minutes). Confirm the Heltec is receiving.
T−20 minStart Serial Studio, confirm gauges are moving, start the CSV log. Start the Python logger too — both run at once.
T−15 minWalk the payload 100 m away and back, watching for dropouts. If it drops at 100 m it will drop at 300 ft.
T−10 minIntegrate the payload. Re-confirm packets after it is inside the airframe — the body tube attenuates the signal and this is where people get surprised.
T−2 minNote the pad altitude reading. That is your zero; everything gets referenced to it.
T−0Do not touch anything. Watch. The log is already running.
T+5 minBefore moving the laptop, save and rename the CSV with the Scout's name and flight number. Unnamed files are lost files.
If it drops out. If telemetry drops mid-flight, that is data, not a disaster. Note the altitude and time of the last packet and say so at the debrief — a dropout at ejection usually means the antenna moved when the charge fired, which is a genuine finding and a fixable one.